Make a blockpy program that generates three plots.
Of those three plots, there should be at least two different kinds of plots. So, two scatterplots and a histogram is great. A histogram, a line plot, and a scatterplot is great. Three histograms is less than great.
For each plot, write about 3–5 sentences about your experience making it. Try to answer questions like:
Is this data what I expected? (I thought it would be numbers, but it seems like it’s not.)
Do I see any patterns or relationships in this data? What are they?
Does this plot even make sense to me?
If this plot seems broken, how would I explain what’s broken?
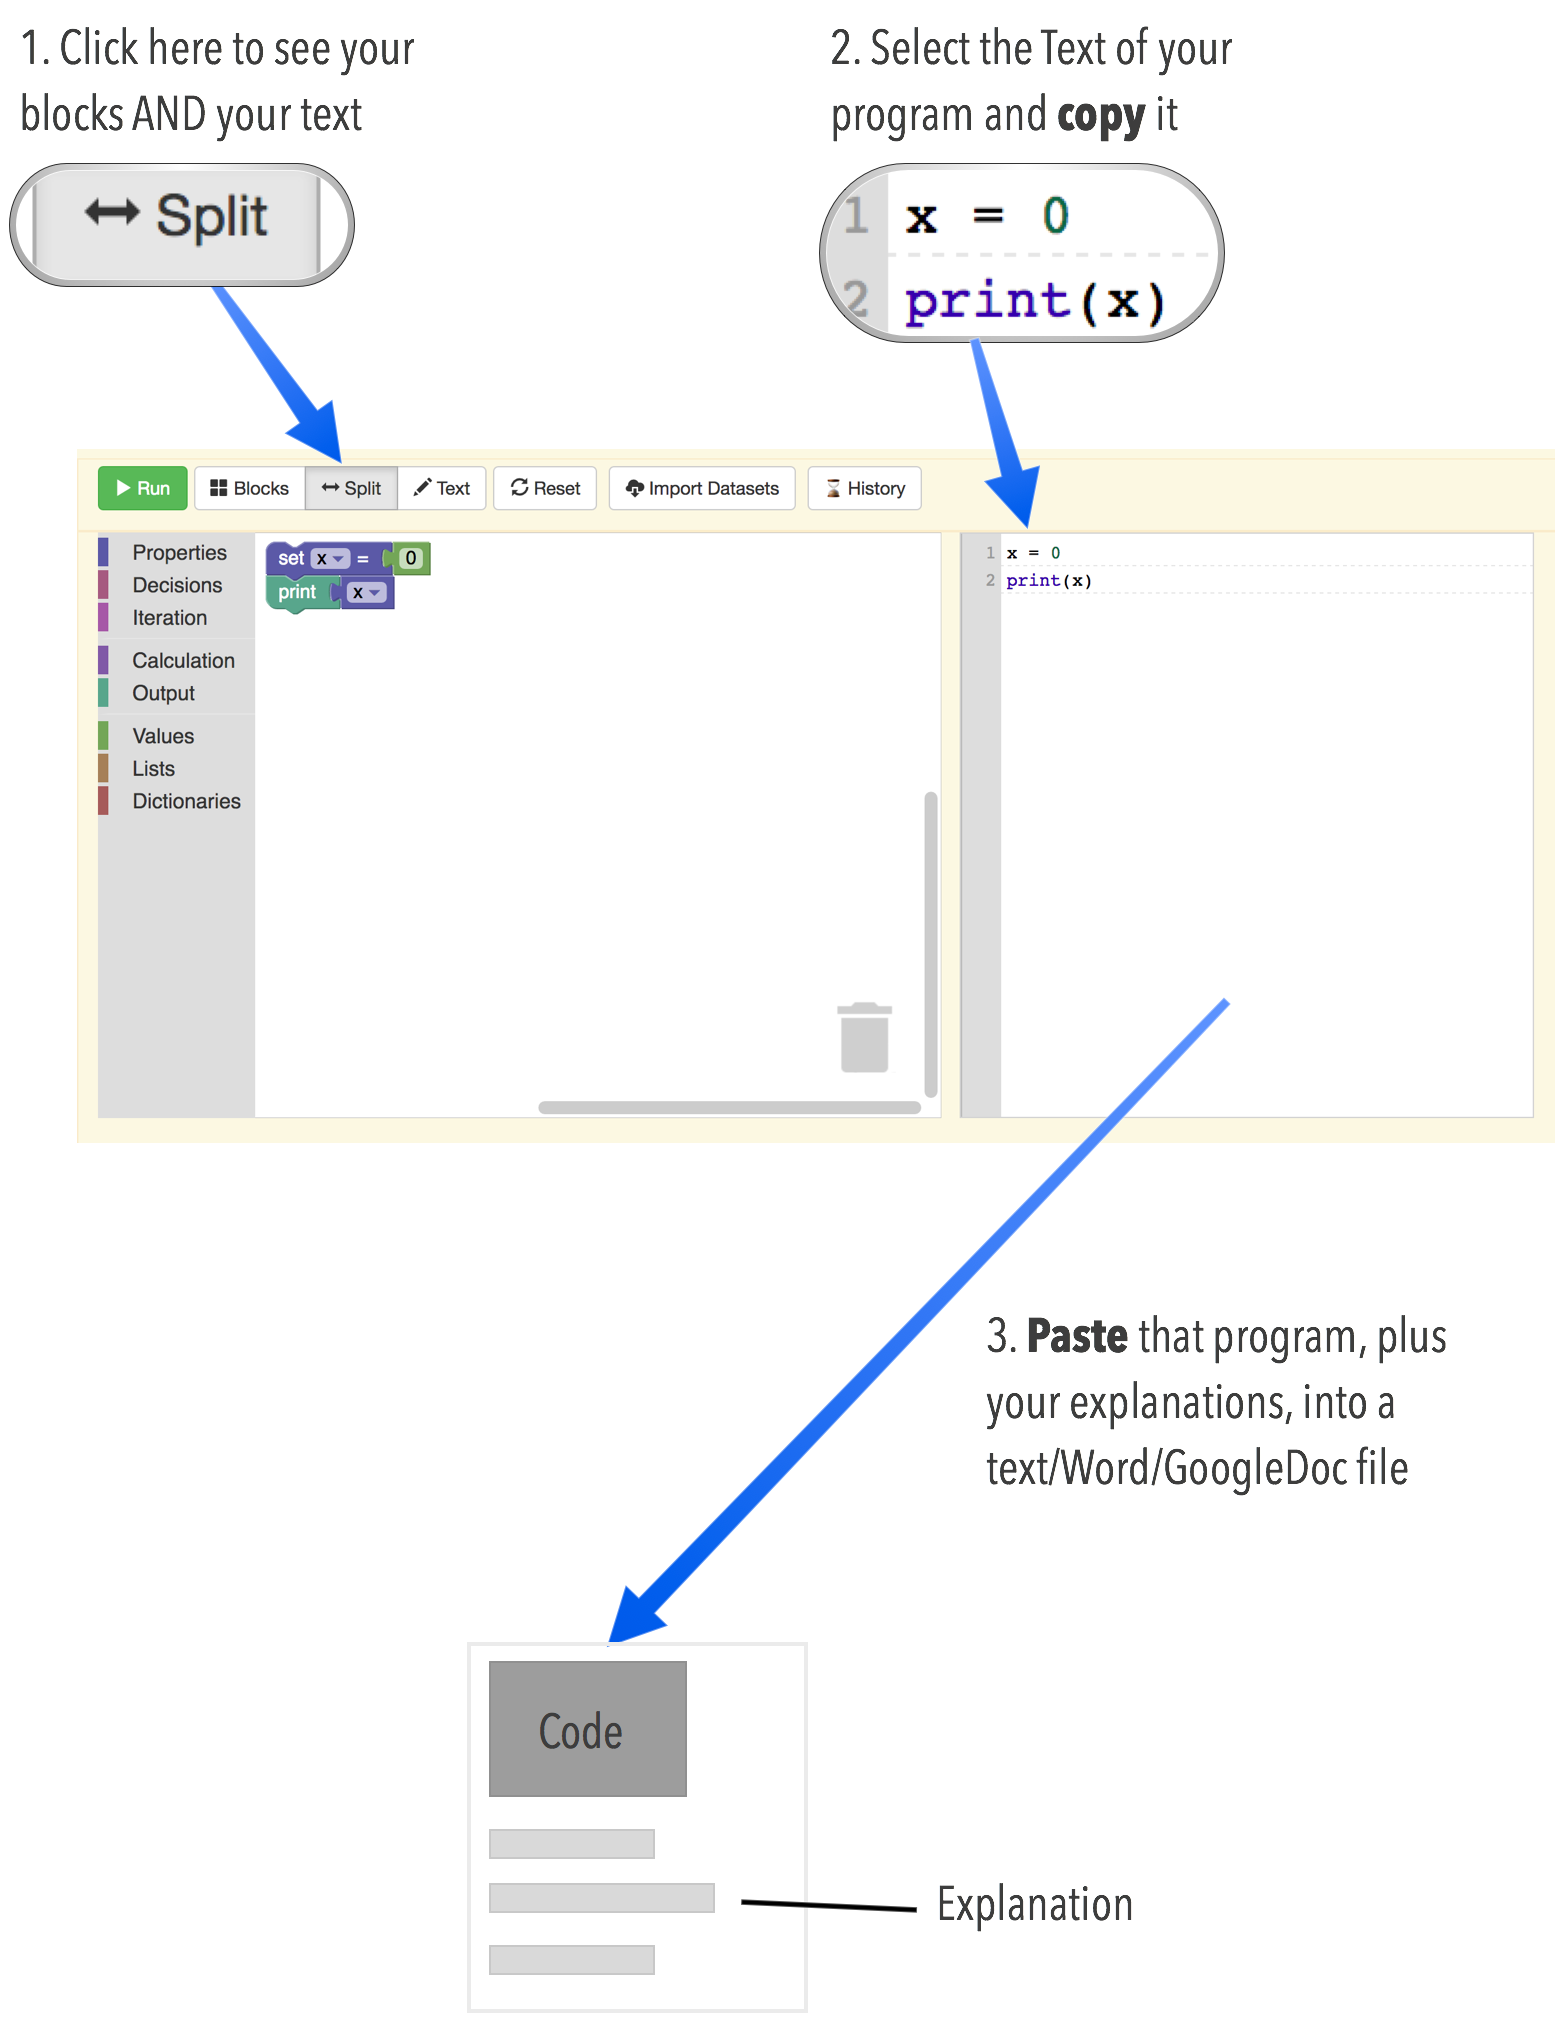
What you should turn in
A document (could be a Word document, or just a plain .txt file) where:
You paste in the text code from your Blockpy program to make all three plots
Today was our first introduction to programming in Scratch. But, before we dug in, I shared two things I thought were important with the class
The course website now has help for physical health
I added two new pages to cmse201.com. The first was information about how to get help if you’re physically sick.
I spoke to the class about mental health
I then showed the class the page on mental health.
Roughly, what I remember saying was:
We care about you. So our first priority is to make sure your bodies and your minds are taken care of. To that end, we put the information for mental health front and center on the course website.
My mom was diagnosed with bipolar disorder when she was about 26. If any of you happen to know Carrie Fisher—Princess Leia from Star Wars—my mom’s bipolar disorder is very very similar to Carrie’s. When I grew up, my mom would periodically have acute manic episodes, and she would need to be hospitalized. That became a part of my life.
When I was in graduate school in my late 20s, I was diagnosed with severe clinical depression and generalized anxiety disorder. I learned I wasn’t alone. A large number of graduate students are diagnosed with mental disorders during graduate school, and that’s no accident. In part it’s a reflection of the structural problems inherent in graduate school.
If I had, say, a broken leg, it would be visible to you. You might look at the boot around my foot and think “oh, my dad had one of those after his skiing accident.” But mental disorders don’t make themselves visible like that, even though they can be very painful and, at their worst, limiting.
I go to therapy and take medications to help me manage my disorders. But, getting diagnosed also formed a lens of looking at life. It helped me understand things that happened to me when I was younger. And, it’s helped me understand that the feelings I have that “I’m a piece of garbage not worth anything” aren’t my fault. Those are depression.
If it weren’t for therapy and medication, I would not be here right now. And, I apologize for getting that serious, but it’s true. If I hadn’t had access to these resources, I wouldn’t be here.
That’s why I want all of you to know that we care about you, and there’s help. You may not need it now. It’s possible you may never have a need to look at this webpage. But as students, every single one of you is entitled to counseling help.
I’m also being honest about this because I’m trying to reduce the stigma around it. You don’t need to feel like you have a problem to seek counseling. I think plenty of people benefit from therapy, regardless of their mental state. It can be extremely helpful to have someone who isn’t your friend, who isn’t related to you, who can see you and your life in ways you may not see it. Someone who can help.
If you’re having an emergency, you can always dial 911. If it’s during business hours, counseling has walk-in hours for crisis handling.
Like I said, many of you may never look at this webpage again, or feel that you need to. But you might know someone who does need help. And sometimes things can get bad, and people who need help aren’t able to do the thing they need to do to get it. So if someone you know needs it, you know who to call and where to go. And you know where to bring them if they can’t go alone.
All the services offered are completely confidential and private. So, again, please know that we care about you. You can always come talk to me at office hours, or by appointment. My office is a safe space. And if you want to talk to someone else, the number is right here.
I know not many courses would spend this much time talking about this. Probably not many courses would put the info on the course homepage, at the same level as the syllabus. But I think this is so important, so that’s why I did it. Thanks for listening.
Hidden figures in the history of computing
There was no easy way to transition from that topic to the next on my agenda, but I tried. Before we got into programming in earnest, I wanted to talk briefly about several women who were instrumental in what we were about to do.
I think I started by discussing Grace Murray Hopper, who was an ultimate badass as far as I’m concerned.
I hope I didn’t inadvertently smudge parts of history, but I stressed to the students that:
Hopper worked on one of the first electronic computers EVER
She was so instrumental that after her mandatory retirement, the US Navy created a position for her so she could keep working.
It was Hopper who pushed against the then-unpopular idea that we should write in human-readable code; we shouldn’t be programming in machine code. So, it’s thanks to her that we have compilers. And, it’s thanks to her that what we’re about to do uses English, and we’re not still manipulating switches and dials on registers.
I also told the class that I strongly recommend they see the film Hidden Figures, which tells the story of three black women who were instrumental to getting us to space in the US Space Race. I stressed that they suffered a kind of double-discrimination, being both black and female at a time when neither were viewed as equal. I told them how brilliant those women were, and how all three of them were real, living, breathing people.
Then, we got on with the remainder of the class.
Introduction to programming with Scratch
Motivating deliberate practice
As an exercise, I ask everyone in the class to raise their hands. “When I say something that applies to you, I want you to put your hand down, OK?”
Then, I move through the following list, again saying “put your hand down if this applies to you”.
Lower your hand if you:
Are or were in Marching Band? about 3 hands went down, and I said “yes! you are my people!”
Play(ed) a sport (including motor sports, sailing, surfing)? I think all but two hands were up, meaning more than 90% of the class fit in those top two categories
Play games competitively (chess, magic the gathering)? Still 1 hand up.
Have been a musician (vocal, instrumental, electronic)? This is where the last hand went down
Have learned to drive
Have learned a new language
I said
OK. I’m asking this because all of you have some experiential basis for doing things like drills, where you do the same thing over and over again. Maybe it’s an end zone drill in ultimate frisbee, and maybe it’s musical scales. But the point is that you’ve all experienced having to focus on one thing over and over, even if it seems slightly removed from the main activity. Most music isn’t scales, and yet musicians practice scales every day. Why? Because they give us practice in moving between notes, so that when we actually play that becomes almost automatic.
Same thing with an End Zone drill. Most of an Ultimate Frisbee game doesn’t happen at the End Zone. But you practice it so that when you are near the End Zone, it’s almost automatic and you move fluidly into it.
As we learn programming, you may find we’re asking you to do the same small things over and over again. And, when we ask you to do that, it’s just like those other drills. It’s so that when we come face to face with more complex problems, you’ll be able to do certain things almost automatically.
Sidenote: I think in some cases people would put their hands down, then a later statement also applied to them and they weren’t sure what to do. Some folks re-raised their hands, which was how I figured it out. “Oh, is it that you’re also a musician? OK, got it.”
Extra Sidenote: this is a great experiential grounding for conditional statements (Boolean OR) as well as cumulative distribution functions (how many items did I have to go through before all hands were down?). We pick up more and more of the class with each category, but the biggest jump was “played a sport”
Before kicking the tires on Scratch
I introduced the concept of a “development environment”, which I told the students we would “come back to later”.
I modeled for them dragging out a few blocks and telling the program to run. (What I always find not obvious in scratch is that to get just about anything to happen, you have to add event triggers. So, I showed them how to set up the “green flag” event trigger to be able to start a program.)
Then I gave them my “kick the tires” speech. In a nutshell, I’m trying to do with Scratch what we did in Maryland’s Science Methods courses (often called “physics 115” for short) for teachers. In my physics 115 sections on “electricity”, we’d have everyone start with a single bulb, a single battery, and one small length of wire. My instructions were:
Take about 5-10 minutes to start messing around with these. Try some ways to get the bulb to light. In your notebooks, record what your setup was to get the bulb to light. But, also record setups where you thought the bulb should light, but it didn’t.
That one activity usually provides enough starting material for the entire semester. And, to be clear, I’m definitely not the inventor of it. About the only thing I think I added was emphasizing that they pay attention to configurations that they think ought to work, but don’t.
As a quick example, this is something that won’t work: running a single wire from one terminal of the battery to the bottom contact of the lightbulb
[battery]-------wire-----[bulb)
To bring it back to programming, there are tons of small parts of Scratch and plenty of things that just aren’t obvious:
what the hell does [block X] do?
how do I delete a block?
how do I make something happen over and over again?
I put the pen down, but I don’t see anything. WTF?
My choice of language is deliberate: “kick the tires” and “what the hell does X do?” are my way of trying to motivate a particular kind of skepticism. I don’t just want them to be inquisitive, I want them to get in there and start smacking (virtual) parts, taking nothing for granted. If it’s not clear what something does, that very well may be the designer’s fault. Treat it as such until you get an answer.
In which we turn them loose on Scratch for 20 minutes
We told them to start working individually, and what followed was the general murmur of activity punctuated by:
questions they started asking each other and answering
meows (at which point I said “aaaaand someone’s found the sounds”)
musical tones
While they worked, I told them I would be working too. So, I hooked my computer to the projector and live-coded on the screen while they were coding on their respective computers.
A few minutes in I scribbled some things on the board and got their attention. I had drawn (I think) a circle, a stair-step line, a diagonal line, a triangle, and a square. When I had their attention I mentioned that if they were looking for something to focus on, they could try creating these shapes in their own environments.
Bringing the class back together after kicking the tires
I tried to start with questions they had. Several had looked up at my livecoding during the exploration session, so I started talking about my code.
That allowed me to bring up ideas like: How can you change a pen color by 10. That kind of doesn’t make sense. It does makes sense to say set pen color to RED. It doesn’t seem obvious that you could do RED + 10. So that’s kind of weird.
We got into a really juicy discussion when I asked if anyone had made progress on drawing a circle. One student, D, said he had kind of gotten it, but there was this straight bit in his circles. His code was essentially:
pen down
move 10
turn 15 degrees
So, I modified my code, and my cat was drawing rough circles. Then D asked “wait, how’d you do that?”
“How’d I do what?”
“Get it to keep going?”
That’s when I realized my code had a repeat block in it, which also made me realize D’s code did not. So, to make a circle D was pressing the green flag repeatedly until his sprite got back to its starting point.
The discussion opened out into:
What if we define circle as “move 1, turn 1 degree”
How can we copy and paste scratch code?
What does defining your own block do?
Why would you do it?
Why define your block when you can just copy and paste the code?
I talked about my dissertation work and how this is still an open problem? How do people get convinced abstraction is worthwhile?
I began today’s class with intentions to have two major sections: recapping our Econophysics activity and beginning programming in scratch. We had several new students who had not been there Monday, so it was an opportunity to show them how the game worked by actually playing it instead of just describing it.
When we set up the game, I gave Seth and Tom instructions to give people a variable amount of starting money. I think I said between three and five coins. But, because we were using Nichols as our base Currensy, people ended up starting with $.25, $.30, $.40, and so on.
Trading lasted about four minutes. Then, we talked about reporting out our results. I followed a plan similar to when I substituted yesterday, where after a few students had reported out, we tried to make guesses about what the next student’s values would be.
Like yesterday, we tried to assign some measure of confidence to each of our guesses. And, like yesterday, some of our guesses were very far off the mark. Having new students in the class gave us the opportunity to use them as unknown values we would try to predict after we had everyone else report out. It gave us an opportunity to talk about what things we might or might not be sure of in terms of those remaining agents’ starting money and final money.
I was able to bring up the notion of consistency checking, as in making sure, for example, that the starting money and ending money amounts were equal to each other. As the final data points rolled in, we saw that our total starting money did not equal our total final money. And, the class seemed with me on being unnerved about that and wondering how it was possible that the money supply changed. It might’ve been clerical error on my part, it might’ve been clerical error on the students park, somebody could’ve brought in change, we just don’t know. But, it was such an awesome opportunity to bring up the notion of consistency checks, and of expectations about a system and when it violates them.
All of our wonderful discussion about guessing, confidence, and updating guessing in light of new information lasted longer than I thought it would. We started discussing the notion of estimators, and the notation for estimators being having a hat on top. The students discovered that two of the parameters we were trying to estimate, namely the number of rounds played in the final money, seemed to be coupled together in someway. As in, if you finish with zero money, there seem to be a greater chance that you played fewer rounds than if you finished with some money.
We also talked about the logic that drove particular estimators, like whether we thought someone was risk-averse or was in bracing risk could determine how many rounds they played. The popular notion in the room was the players who played more risky had the potential to blow out early and us were more likely to a place you were rounds and finished with zero. Because we allowed people to bet some or even all of their current cash holdings, there was a sense that people who are risky would try to go all in and that many all and that’s what fail, or at least some all and that’s what fail, and if they were early that got people out.
So, in trying to estimate three quantities—starting money, final money, and number of rounds played—we had different estimators for each based on potentially different logic. Our starting money estimator came from trying to get a sense of what the most common starting value was. Because none of us knew exactly how many pennies Tom and Seth gave to each player, we had to keep estimating down to the very end.
And, when we were down to the last agent, we went through different stages of feeling like we had absolute certainty in our predictions or feeling like we had no certainty at all. We felt it when we knew all but one person starting money, we could predict that final person starting money simply by looking at the difference between the final money and our current sum of initial money. But, we realize that potential he, the last unknown agents parameters could be anything, because they have could have finished with exactly as much money they started with. And, if that were the only constraint, then starting with $.20 or starting with $4.00 were both possible states this last agent could have had. To say nothing of her finishing with less or more money than she had before.
At that point, I thought the ground had been set to talk about degrees of freedom. Specifically, as something that might have seemed abstract or hard to remember from high school math, but was very concrete with the data in front of us. If we knew her starting value, then we could predict with absolute certainty what her final value was, assuming money was constant. And vice versa. If we knew how much money she finished with, we would exactly know her starting money, because it would be the difference between the current some of starting money and the total sum of all final money. Knowing one gives us the other, which is what degrees of freedom is all about. If we know neither, it’s still the case that exactly one value will be determined by the other’s.
By the time we finished degrees of freedom, it was 430. I didn’t want to cram scratch into the final 20 minutes of class so I made it on the fly decision to wait until Monday for scratch. And, I used the remaining time instead to have all students get set up on the Slack we created. Slack set up was surprisingly easy, and I think in total it took less than five minutes. As of now, we are certain that 90% or more of our class has successfully joined our Slack.
Because we still had time, I choose to use the last 10 minutes to build outward from the activity we had done today to how it fits into the larger scheme of the entire course. I showed the students that just about every single learning objective was something we touched on in the past two class days: creating a toy system, getting data from that system, determining the shape of our data, augmenting that data with additional information if it’s available, using numerical summaries to run consistency checks, predicting values based on past history, updating a prediction engine in light of new evidence/data, visualizing data, performing math on data, considering different types of data such as geospatial data (where trades happened in the classroom). And, this can serve as an anchoring point later down the line when we talk about different data types. We’re now already familiar with one column data, which is effectively a one dimensional list or one dimensional array. We are familiar with collections like a dictionaries, because each student had the round codename, and that codename corresponded to a real person’s name, but those weren’t in any particular order. So, when I would call that a codename, exactly one person would respond, and that’s indexing/subscripting a dictionary.
Finally, I brought it all home by drawing an abstract representation of our game on the board. I think it was two squares which represented agents, and triangles that moved between them which represented money. I pointed out that we could replace the entities in our system with other things, like making agents particles, and making money momentum. And if we made one rule change—allowing broke agents to still trade and potentially earn money back— then our toy game was an effective model for particle collisions in the real world. I stressed that that notion, the creating a game with changeable entities that mimics something in the real world, is where so much of the power lies in modeling. It is modeling. And I tried to stress to them they had now done everything that this course was about.
I told him I was excited to see them next week when we begin programming, and I let the class go at 4:50
Action Items
Tom/Seth and Brian will model going through Scratch and making predictions, observing the outcome, then reconciling.
Give students individual time to do that themselves
Have Tom call IT in class on Wednesday when students are working in Scratch
Have the class define what they think a “distribution” is(?)
The Jargon Buzzer
When we “kick the tires” on Scratch, we should really encourage them to imagine they’ve got hardhats and clipboards. “Bang on this. Move that. Try shoving these things together. But be reflective!”
Below is the email I sent Professor Murillo after I covered his class for the first day.
Things We Covered
We did the entire econophysics exercise. And, during discussion, we did a few things I’ve never done before. Here’s a summary:
We had students report their final data (number of rounds and final wealth) one at a time, which I record in a spreadsheet projected on the board.
After the first five students reported out, we talked about the idea of the Bayesian Urn, and we tried to make predictions about what the next datapoint would be
Then, we had the next person read out their data, re-updated our guessing confidence, then made a prediction about the next student
We talked about using available information to constrain our prediction space (there were only 24 coins in play, so if we’ve only accounted for 3 coins among the first N students, what’s the upper bound of coins the next student could possibly have? What’s the likely value of coins?)
It culminated in us being able to confidently guess the data for the final three students, and we knew for certain the data of the last student before they even reported out.
When we finished reporting out, we talked about large scale patterns we noticed, and possible mechanisms that caused them. For example, pockets of high wealth possibly resulting from people engaging in trades only with those near them.
I summed up how the things they experienced were a microcosm of the entire course. I stressed that together we’d already experienced states, state updates, data visualization, time-evolved simulations, update rules, predictions, confidence, updating a bayesian decision unit with new information, and even string processing (I have them tell me the agent codename they want listed on our results spreadsheet, then I type it out, often literally. Examples: “Just leave it Blank” and “Sarah with an H”
Finally, I connected our activity out to the world of larger econophysics. I explained how econophysics is about applying statistical physics to financial situations, and how we could easily swap “money” for “momentum” if we were atoms. Crucially, our game concentrates everything to a few people or just one person, but if the universe worked that way with momentum, there would be one atom with all of it, which is clearly not what we see. But we see that in our game. Why? Because students didn’t allow for broke people to still trade and get money, but in the natural world “still” particles can be hit by moving ones and absorb some or all of the momentum of the incoming particle.
In my section, I stress the importance of diversity and making sure all students feel valued and welcome in our classroom community. But, in the flurry of all of the ideas, I forgot to do that with your section.
Action Items for you
Not everyone received the email with the course survey and introductory video, so they asked if you could re-send that to the entire class. (I think some people were late adds to the course)
Best,
Brian
Reflections on the First Day of Class for CMSE 201 Spring 2017
Our classroom is obviously too small for what we want to do. While it worked to have everybody standing up, I don’t know what’s going to happen when we need them to sit down and work in groups.
I was a bit uneven with the econophysics activity, because I had forgotten to refresh myself of all the places where we stop,make a prediction or drawing, and then continue.
One interesting rule variation that came up is that one student, D, wanted it so that if you played rock paper scissor and that rock paper scissor was a tie, then no money was exchanged. We had the class debate that.
I was pissed because I don’t know what happened to all the pennies I got last year, but we certainly didn’t have enough money so that people could start with 10, 20, or 30 pennies.
So, when we allowed students to bet more money, we also had them start with two pennies apiece.
One thing I’m seeing when I ask them to draw pictures is that when I ask them to think about long run behavior, ideas about the bell curve come up. Pictures of distributions come up. But then I think both cases where students drew distributions as their idea of long-run behavior, or at least, continuous distributions, they didn’t label the X or Y axes. I’m guessing that for next class I might try to institute Gina’s idea of a jargon buzzer.
I’m not sure if I can do it, but I really want to help shape the norm that we shouldn’t be OK with things we don’t fully understand ourselves. Not that it’s wrong to have those ideas, but that as thinkers, we should recognize it if we don’t fully understand something, it’s an opportunity to learn, and to try to rephrase what we do understand.
I didn’t show them the whole syllabus, just the first few bullet points which were things that I promised they would be able to do by the end of class. The end of the semester that is. But, when I finished class, I focused on the idea that we as a classroom are a community. That everybody brings diverse points of view, and I will work to make sure that everybody feels included.
At the end of class, one student, EZ, told us that he had been thinking about dropping this class, but now he was going to stay. They happened to be a student whose name I knew because I had looked at the class roster with images over the past few days. I don’t remember everyone, but I did remember them. They had gotten to class about a minute late, and so as they walked to their seat I extended a hand, said it’s good to meet you EZ.
I wonder whether that helped make a difference. For all I know, it probably didn’t. But I’m still glad I did it.
Action Items for next class
Finish Syllabus
Write quiz
Create scratch examples
Give them a dedicated 10-20 minutes of time kicking the tires on scratch. “Go find something interesting”. Make them write 3? Predict-observe-explain cycles while they’re kicking the tires
Then, some focused time with a specific goal.
Augment our class data with prof Murillo’s class data
Make a plot of rounds played vs. penny count
My coauthor Wil Doane and I are open-sourcing our ICER 2016 submissions.
My coauthor Wil Doane and I are open-sourcing our ICER 2016 submissions. For each paper, you’ll find
A link to the Github repository, which contains not only the entire source code of each manuscript, but also the entire commit history. You can see how we went from initial commit to final product, browse our pull requests, and see blame views for the entire manuscript.
A PDF containing
The submitted paper itself
All reviewer reports (including a meta-review)
The ICER 2016 guidelines for reviewers
A link to a discussion issue, where I warmly invite you to leave feedback and start conversations
Title
Download (PDF)
Join the Conversation
Reconstructing design thinking and learning through code snapshots and clinical interviews (Source)
I’m doing this for five reasons (at my current count):
Teaching. In my entire graduate career, I never once saw the review history of a paper I didn’t write. And by and large, we don’t design our graduate courses around that. Sure, we pack our syllabi full of influential research and cornerstone pieces, but we don’t get to see how those pieces were made. We also don’t get to see how the community (in the form of reviewers) thought about and responded to those pieces, or what changed on their journey from initial submission to final acceptance. If that’s going to change—if we’re going to provide the community with worked examples of our own scholarship—it has to start somewhere. So I’m offering up my work.
Exposing the Scholarly Writing Process. When I wrote my first first-author article, I filled a folder with more than 100 drafts of the manuscript. Each draft had entire conversations in the margin between me and my co-authors. The manuscript itself is now published, but what aren’t published are the dozens of conversations we had in those marginal comments, arguing (formally) with each other, persuading each other, convincing each other. The research was in the manuscript, but the dialectic was in the margins. We also had three separate rounds of review, and our second round included seven different reviewers. In each round we wrote the editor to respond to every single point the reviewers raised; in one of those rounds our letter to the editor was more than 10,000 words long. But none of that material—neither the marginal dialectics nor the carefully considered arguments we made to reviewers and editors—is available to current scholars. With this open-source project, you can start to see how Wil and I engaged in our authorial back-and-forth. It’s nowhere near a complete record of our conversations, but it’s a start.
Continuing to Advance the Review System. Reviewing is hard, thankless work. And, odds are if you’ve submitted your work anywhere, you’ve experienced feeling like “the reviewers just don’t get it,” or “I addressed that on page 6!” or “Thanks, reviewer, for pointing out you’re dissatisfied while offering me no information on how to make you satisfied.” Our systems are imperfect, but we’re trying to make them better. And in that spirit, I’d like to point out a major disconnect between two different kinds of review I’ve been a part of. As an NSF review panelist, I’ve reviewed dozens of proposals where I had reservations or concerns. And every time I’ve raised a concern, the panel works to basically say “could the authors resolve your concern in a quick phone call/email, or is this the kind of concern that would require substantial revisions to the proposal?” The process of NSF reviewing allows for a certain limited back-and-forth with proposal authors, such that certain concerns can be triaged as not threatening the entire proposal. Our current ICER review process doesn’t work that way. We have no formal request-for-clarification/rebuttal mechanism. And, while I know about (and appreciate) the strides we’ve made with meta-reviews, I can easily identify comments in my reviews where having the chance to rewrite just one paragraph would have addressed reviewer concerns. If it’s happening to me, it might be happening to other people too.
Keeping Knowledge Open. I think our scholarship should be as open as we can make it. If these papers had been among the 25% of papers accepted, they would—as far as I know—have been published behind the ACM digital library’s paywall. And while I know that not all CSEd research is publicly funded, this research was. The nation entrusted me and my colleagues with the means to investigate; I won’t betray that trust by making them pay again for my results.
Fighting for the Legitimacy of Method. In their 2007 paper on acceptance and belonging in engineering education, Foor, Walden, and Tryttenden reflected on why they chose to conduct ethnographic research:
Accepting qualitative research, especially ethnography of the particular, into the toolbox of engineering education research provides a microphone for the voices of the marginalized to be heard. Ethnography of the particular allows us to hear each and every voice that would otherwise be lost in aggregate ethnography or statistical analyses. (p. 113)
I can’t claim that my ethnographic work is good enough to make it into ICER. The reviewers ultimately judged it wasn’t, and there’s no formal way for me to argue the case. What I can say with certainty is that those of us who conduct ethnographic work are still fighting for legitimacy in CSEd and engineering education. We still have to fight reviewers who have problems with ‘small-N’ studies, and the reviews you’ll see for my manuscripts prove it. And, to be clear, I’m not suggesting that, say, experimental design research doesn’t have to justify validity. It does. The difference is experimental designers have to defend their implementation of a research method; they don’t have to defend the epistemlogical legitimacy of that method. Put another way,—if research methods were objects—an experimental designer needs to defend their instance; ethnographers in CSEd have to defend the entire class itself. And ethnographers have to defend that class almost every time they want to publish in CSEd. Even though Erickson defended it in 1986. Even though Schoenfeld defended it again in 1994. And even though Andy Elby, Ayush Gupta, and I defended it again in 2014, with an entire section of our manuscript defending not just our instance of small-sample ethnography, but the rigor and value of the entire class of small-sample ethnography. If we have to justify our method’s legitimacy in every manuscript we write—even and especially when the venue is meant to represent the bleeding edge of CSEd research—it’s one more narrative burden, one more place reviewers can ding us, one more dimension that separates us from other kinds of research, and one more sign that while our community might say it embraces this method, we still have farther to go in making that true. And if you don’t believe that, reflect on the last time you got a reviewer comment that said “the problem with this study is that the N is just too large.”
References
Danielak, B. A., Gupta, A., & Elby, A. (2014). Marginalized identities of sense-makers: Reframing engineering student retention. Journal of Engineering Education, 103(1), 8–44. http://doi.org/10.1002/jee.20035
Erickson, F. (1986). Qualitative methods in research on teaching. In M. C. Wittrock (Ed.), Handbook of research on teaching (3rd ed, pp. 119–161). New York : London: Macmillan ; Collier Macmillan.
Foor, C. E., Walden, S. E., & Trytten, D. A. (2007). “I wish that I belonged more in this whole engineering group:” Achieving individual diversity. Journal of Engineering Education, 96(2), 103–115. http://dx.doi.org/10.1002/j.2168-9830.2007.tb00921.x
Schoenfeld, A. H. (1994). A Discourse on Methods. Journal for Research in Mathematics Education, 25(6), 697–710. http://doi.org/10.2307/749581
Window translucency behavior is weird in Yosemite screenshots
Apple’s translucent design in OS X 10.10 (Yosemite) has some weird consequences.
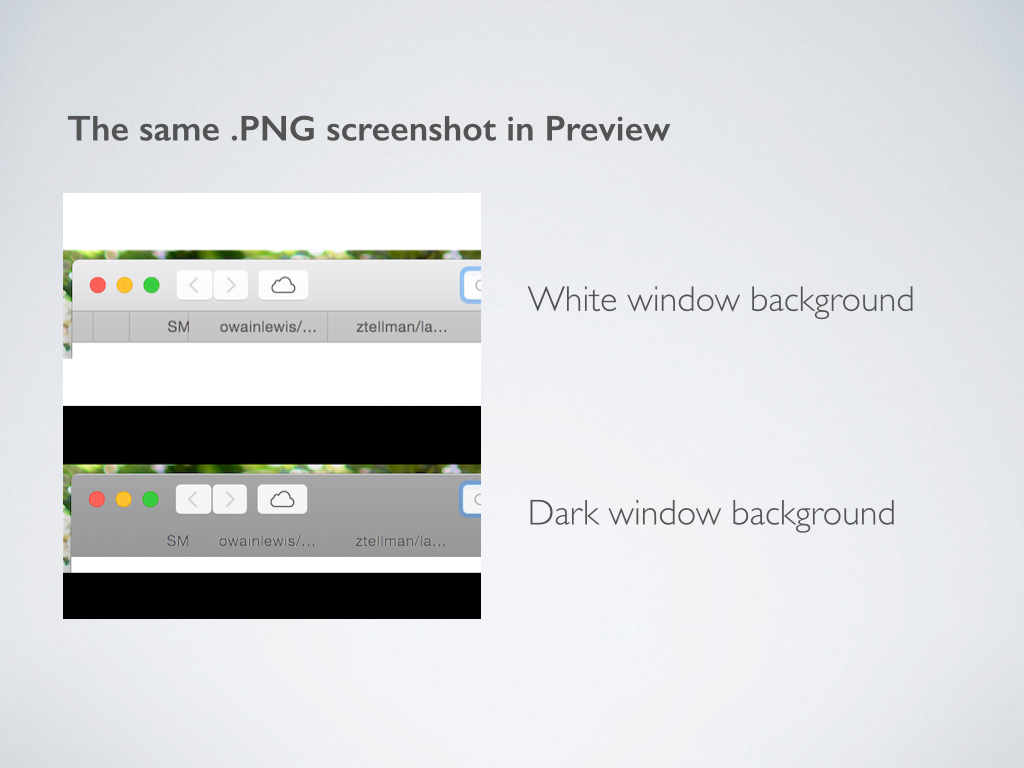
My friend Adam took a screenshot of Safari running on his Mac using Cmd+Shift+4. When he sent it to me, I used my iPhone to capture some odd behavior: when I tapped the image in our Messages thread, the appearance of the screenshot changed depending on whether the background I was viewing it under was black or white. When the background was black, the Safari window completely changed in appearance.
This color-changing behavior struck both of us as weird, because Adam sent me a static screenshot. The only explanation we could come up with was that in the screenshot Adam took, OS X included some alpha channel information for the safari window itself.
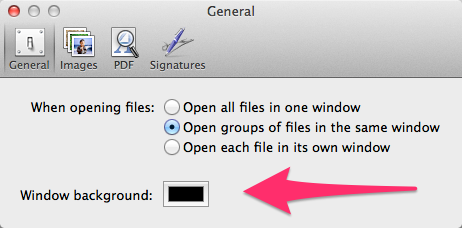
To test our guess, we both fired up Preview.app, opened the screenshot, and captured how it looked when we adjusted Preview’s “Window background” setting:
With a background set to white, the Safari window itself appears light, with well-defined delineations to visually separate tab titles. When we switched the background color to black, the Safari window darkened considerably, and tab delineations were much harder to spot. Curiously, changing the background color in Preview didn’t affect how the underlying wallpaper in the screenshot (in this case, flowers) looked at all. The background color change only affected the Safari window, which itself was in focus.
This behavior isn’t necessarily “bizarre,” though it did for awhile have me convinced of some kind of hidden voodoo when I viewed the image on my iPad.
At the end of the Ph.D. process, the department I graduated from sent me a survey about my experiences. I wanted to share the feedback I gave them on one specific question. Yes, it’s opinionated, and I welcome comments.
They asked:
How would you Improve your graduate program?
I answered:
The single biggest change I would suggest is a reform of the required two-course introductory statistics sequence for graduate students. (I took [multiple linear regression, the optional third course in the sequence] with [redcated] and I thought it was excellent and extraordinarily useful).
How would I change the course sequence? I’m not positive, but here are my suggestions:
The courses should focus on producing researchers who can be informed consumers and critics of quantitative work, even if (and especially if) the students in the course will not go on to be quantitative researchers
The courses need to be about thinking statistically, not following rote procedures for analysis in SPSS.
The courses should always use real datasets. Toy data sets are contrived, and they bypass so much of the work and thinking that goes into cleaning data. Worse, analyzing toy data produces toy results, which hardly help anyone.
Courses should focus on exploratory data analysis, including (and especially) visualizing data.
If the courses are going to incorporate doing statistical analysis, they should move away from SPSS. There’s no reason students should have to pay for statistics software when there are fantastic, FREE, industry-standard software toolkits to do statistics (including the R+Rstudio ecosystem and the iPython Notebook). Think about it: not only are we asking students to pay NOW when they take the courses, we’re also only teaching them that system, which means later in their careers they’ll have to spend more money to buy SPSS again, because it’s the only system they were trained on.
I really can’t emphasize that last point enough. With the graphical and statistical funcitonalities of R, Python, and other languages, I can’t think of a single reason this course should continue to be taught in SPSS, which costs money, graphically underperforms, and chains students to a for-pay software ecosystem.
Coverage of my Advanced Placement Exam data graphic
In a previous post I took a crack at re-visualizing data from high school Advanced Placement (AP) exams. I’m interested in the dataset because of what it shows about students’ participation in science, technology, mathematics, and engineering (STEM) subjects. But, I took a particular interest in how some outlets were representing the ratios of males to females who take the exam.1
I’m thrilled to find people are circulating my revised graphic. For example, Mark Guzdial used it in a post on his blog for the Communications of the ACM. There, he noted that not only does the graphic give a better sense of the gender ratios for all exams, it also reviews the overall low participation in AP Computer Science exams, shown by their small dot size.
I’m also excited to say that my graphic will be featured on the Visions of Science Vodcast. Visions of Science is a web video series focused on how scientific images convey meaning and aid understanding. The show is made possible through the generous support of The Association for the Cooperative Advancement of Science Education (ACASE), and I hope you’ll check it out once our episode goes live!
I’m trying to be careful here to use the terminology afforded by the data, in this case, “male” and “female.” For me, both personally and research-wise, biological sex and gender are substantially and consequentially different. I’ll leave my fuller views on gender out here, and suffice it to say that in general, I think gender is a text-field, not a binary radio button. ↩ </fn></footnotes>
Creating a better data graphic for Advanced Placement exam data
During the past week, tech and education writers have been talking about data showing that the gender gap in the tech world is evident even in high school.
They cite Barbara Ericson, director of computing outreach at Georgia Tech, who recently broke down the 2013 Advanced Placement exams and found that in three states (Mississippi, Montana, and Wyoming), zero girls took the AP computer science test. Even in the state where girls are best represented among computer science test-takers, Tennessee, girls only took 29 percent of the exams.
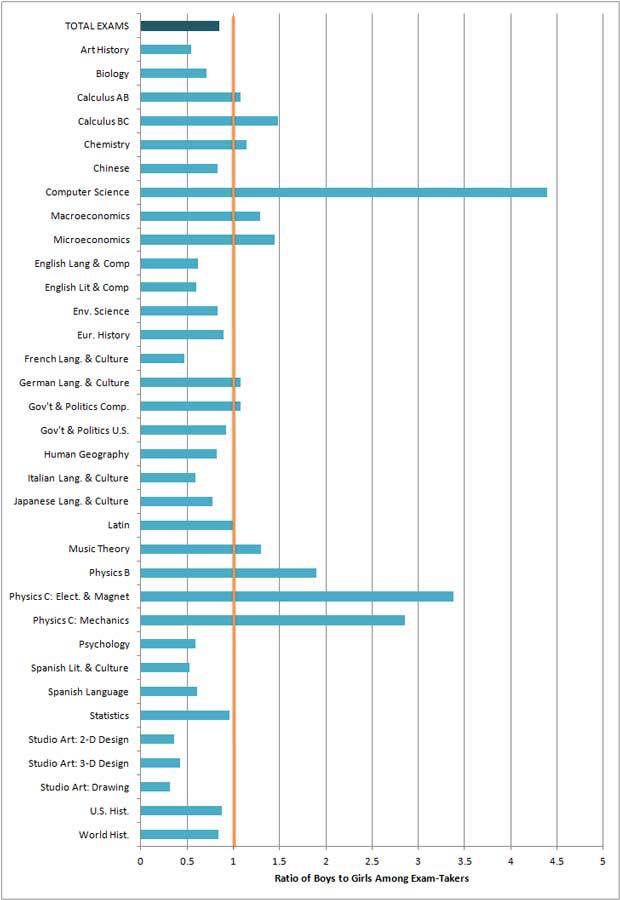
I think this graph has a number of great features:
Since the TOTAL EXAMS bar at the top doesn’t break 1, we can see that there’s less than one female student taking an Advanced Placement (AP) exam for every one male student who takes one.
The most egregious disparities where male test-takers outnumber females are in mathematics and science, because those bars are manifestly higher than the orange line which represents a 1:1 male:female ratio
Of the math/science exams, computer science has the greatest gender disparity. More than four males took the test for every female who did.
But, I think this graph isn’t as good as it could be, and here’s why:
There’s no useful ordering the list of exams; they’re alphabetical. This lack of ordering is a classic case of what Howard Wainer (and subsequently Andrew Gelman) call the “Alabama First” error. When there’s a chance to order data in more meaningful ways, we should.
This is a big one to me: a ratio cannot shrink below zero, but its growth is effectively unbounded. This graph has an x-axis which goes to zero. Empirically, it’s impossible for any test that a student actually took to have a zero ratio. But there’s an even bigger problem.
The choice of a ratio scale means that there’s far less visual space to show classes where females vastly outnumber males. In French Language and Culture, for example, females outnumber males more than 2:1. That’s a greater disparity than the gender disparity in Calculus or Physics B. The gender disparity in Art History is also nearly 2:1, which makes it a far greater disparity than the 1.5:1 we see in Microeconomics. By setting a ratio scale that goes to zero, it’s much more difficult to spot the places where females may be greatly outnumbering males, which I would argue is also a gender problem.
Making a better graph
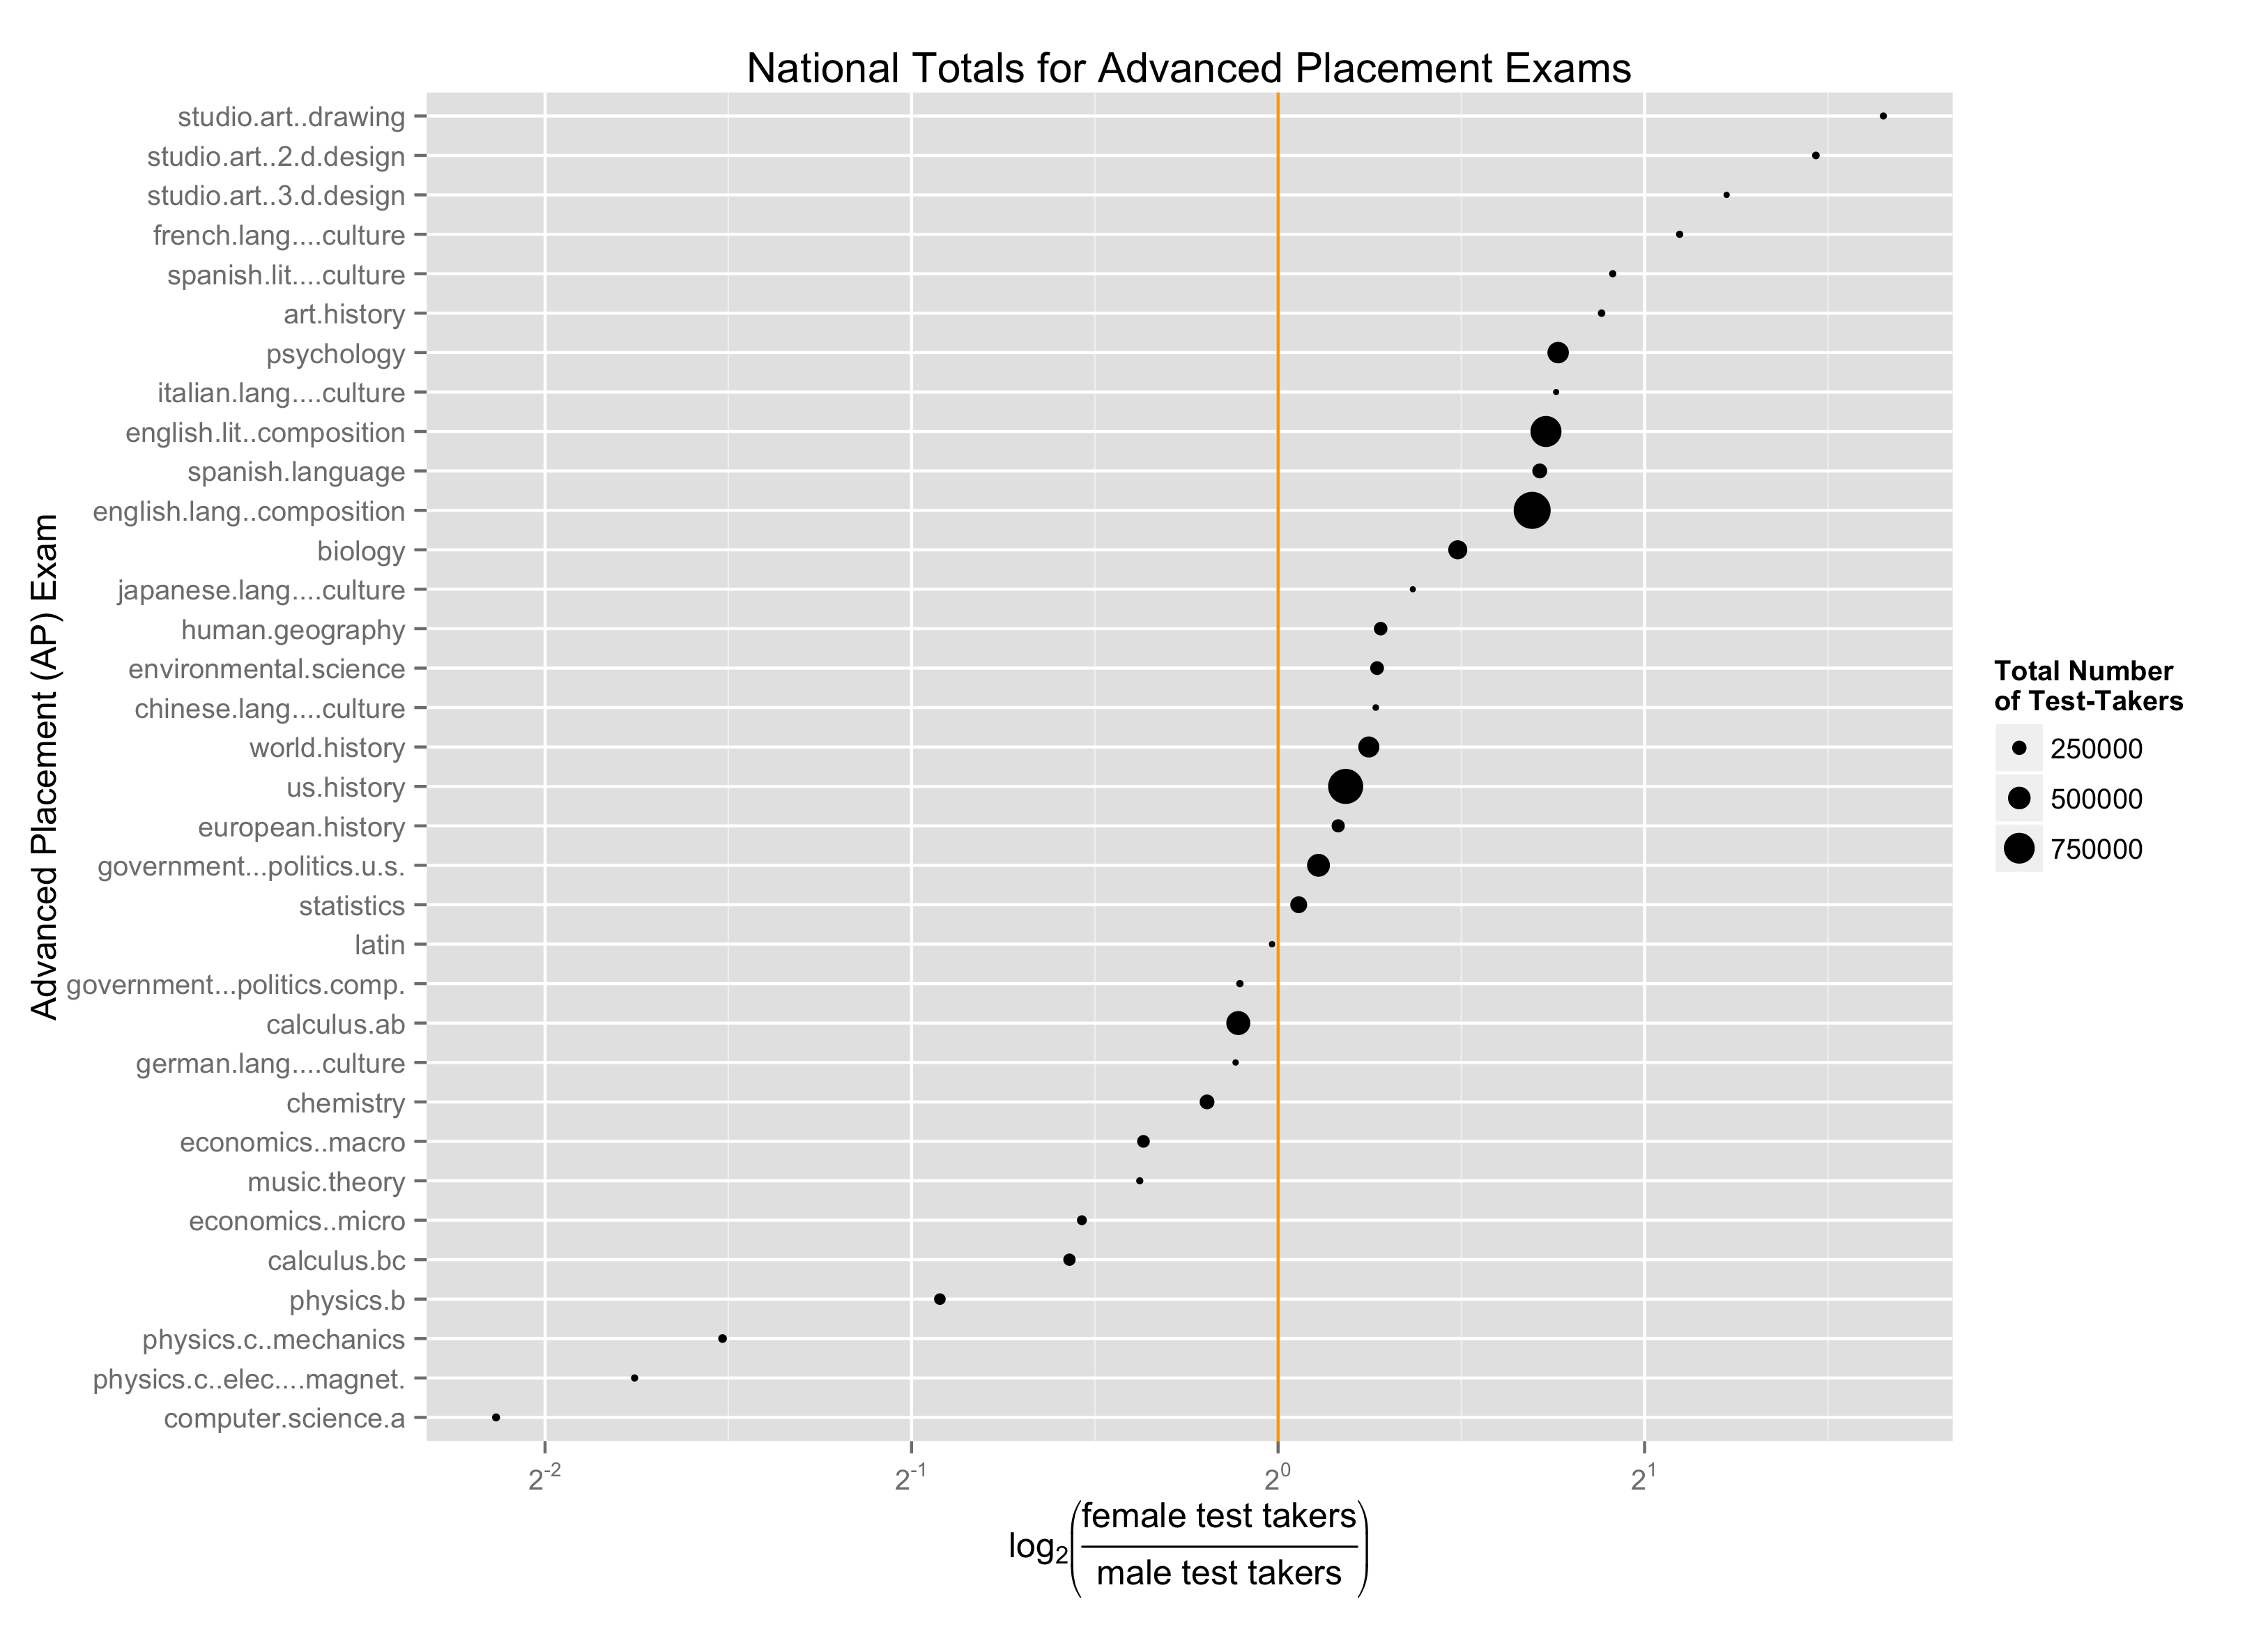
My mentor William E. J. Doane is fond of saying you shouldn’t criticize without offering a better solution. So, with my thanks to US News and Mark for getting me thinking about this, here’s my refined graph, made with help from Angela Zoss (click to embiggen)
Why do I think this graph is more helpful?
Instead of using a ratio scale, it uses a log-ratio scale. That means equal distances from the center line correspond to equal degrees of gender disparity. Computer Science A is still an extreme disparity (more than 4:1 females to males), but now we clearly see the cluster of studio art courses, all of which have a greater than 2:1 female/male ratio.
It maps point size to total number of test takers. The disparity in computer science A is a problem, but one of the things that jumps out is that nearly three times as many students took English Language Composition, where the gender balance is decidedly skewed female rather than male. The same is true for English Literature Composition. And Psychology, which has roughly twice as many students taking it, also has more than 1.5 female test takers for every male test taker.
Instead of alphabetical ordering, it orders by the degree of gender disparity. Computer Science and Studio Art are at the extremes. Science and math are toward the bottom. But what also stands out is the degree to which humanities-focused courses (art, romance languages) are imbalanced in favor of females, sometimes exceedingly so.
Now it’s your turn
I’ve open-sourced all of this work under an MIT license.
We want you to help us with an experiment. My friends and I are starting up a video podcast on visualizations in science. We think of ourselves as Robert Krulwich‘s geeky, inquisitive extended family. But, we’re the weird branch that’s super-obsessed with visualizations. In each episode we’ll feature experts in science and representational domains having conversations with us.
Our aims are to:
Disseminate powerful scientific visualizations to wider audiences
Promote the public’s understanding of scientific representations
Provide existing research projects a venue for engaging broadly with the public
Showcase positive, diverse role models for people considering careers in Science, Technology, Engineering, Arts, and Mathematics (STEAM) fields
We made a (very rough) proof-of-concept episode that we want to share with you. And, with your support (see our survey we might be able to turn this into a professional reality).
This was our first time. It’s a rough draft, it’s unedited, and there are ragged edges.
We only had one hour to write, produce, record, and post this entire show. Imagine what we could do with more practice.
Actual shows will never be this long (28 mins), but we wanted to illustrate different types of segments.
With your help (by filling out the survey) we may be able to secure grant funding to get professional equipment and make high-quality future shows a reality.
Please take our work in the spirit of a start, not a final product
For example, a well-known misconception among students learning about looping is the expectation that iteration can end in mid-loop, the instant a termination condition becomes true. And yet in this document I will present a language with looping constructs that work in just this way, are accepted as perfectly reasonable by inexperienced programmers, and are used by them to build effective robot behaviors. Does this mean that the old “misconception” can now be discarded as another artifact of the arbitrary requirements of an immature medium? Actually, in this case and many others, I think something much more interesting happens. What used to appear as a relatively isolated misconception is transformed into a part of a more general learning challenge with clearer connections to the rest of the world. In this case, for example, children still need (eventually) to master the differences between the two kinds of looping and the appropriate uses of each, along with parallel distionctions throughout the language. But in the meantime, they are free to use a construct that matches their intuitions and meets their needs.
[Source][1]: (Hancock, Unpublished Doctoral Dissertation, p. 17)
Using Calendar Programs to Think About Procedural Abstractions
This post explores procedural abstraction, a fundamental concept of computer science and software design. First, I give a rough (and overly formal) definition of what I think procedural abstraction is. Then, I talk about a concrete issue from class: how can we think about procedural abstraction for a program that prints a 12-month calendar? I share my own representation for how I wrapped my head around what to abstract in a calendar program. Finally, I close with remarks about why procedural abstraction—both what it is and how it’s taught—might matter for my research.
Intro
Today’s class covered a whirlwind review of topics from Intermediate Programming. The early parts of class focused on some basics of the C language: input and output, primitive data types, procedural control (if/else, while, for loops), to name a few.
But, when we got to talking about procedural abstraction. Procedural abstraction seems to be one of those things that everyone talks about but it’s hard to find a definition of. So, here’s mine:
procedural abstraction: A name given to the process of observing, characterizing, unifying, and deploying an otherwise distributed (and re-used) set of instructions
Pretty diffuse and hard to think-through, right?
Below, I’ll go into great depth and describe how to think about procedural abstraction for the specific example of a program that prints 12-month calendars.
Procedural Abstraction with calendar programs
The instructor demonstrated a piece of C code ([year.c][1]) designed to print out a 12-month calendar. When you compile and run year.c, you get this:
Enter a day of the week (0-6):
You’re not told:
That the input range 0-6 is supposed to be integers
That each distinct integer represents a weekday
That the weekdays are mapped consecutively to the integers, with Sunday being 0
But, for this discussion those oversights aren’t important. What is important is that the program generates a 12-month calendar assuming that the first of the year falls on the day you specify as input.
So, for example, the printed output of a single month (January) might look like this if you input 3:
Su Mo Tu We Th Fr Sa
          1  2  3  4
 5  6  7  8  9 10 11
12 13 14 15 16 17 18
19 20 21 22 23 24 25
26 27 28 29 30
And multiple months would look like this:
Su Mo Tu We Th Fr Sa
                 1  2
  3  4  5  6  7  8  9
 10 11 12 13 14 15 16
 17 18 19 20 21 22 23
 24 25 26 27 28 29 30


 Su Mo Tu We Th Fr Sa
  1  2  3  4  5  6  7
  8  9 10 11 12 13 14
 15 16 17 18 19 20 21
 22 23 24 25 26 27 28
 29 30 31

 Su Mo Tu We Th Fr Sa
           1  2  3  4
  5  6  7  8  9 10 11
 12 13 14 15 16 17 18
 19 20 21 22 23 24 25
 26 27 28 29 30
Note that the months aren’t labeled (we’ll come back to that later).
If you were a student being given that task for the first time, how might you decompose it? There are several sets of considerations that might occur to you:
Visual Considerations
How should the overall display be formatted?
How can I wrap the days 1-31 around the calendar?
Should the months appear side-by-side? In sequence?
User Considerations
Are we going to standardize on the Gregorian Calendar?
Should the names of the weekdays be in English?
What about leap years?
But then there are the sets of concerns that are at the heart of the program’s logic. Beyond how it looks and what it affords, how should the thing work?
The answer to how it should work depends on how you see the problem. It also depends on whether you see certain aspects of the problem space you can exploit. Since different months have different numbers of days (30 vs. 31), you might decide to write a code section for each month.
Below is the code section for January. It assumes weekDay is the number of which day of the week (0-6) starts the month of January. Also, the percent sign (%) indicates modulo division; that’s actually a pretty clever way of solving the display problem “how do we wrap dates around when the week ends?”
/* Print January */
printf(" Su Mo Tu We Th Fr San")

/* prints spaces before the first date is printed */
for (i = 0; i < weekDay; i++) {
  printf("   ");
}

/* prints the dates */
for (i = 1; i <= 31; i++) {
  printf("%3d", i);
  if (!((i+weekDay) % DAYS_IN_WEEK))
    printf("n");
}
printf("n");
If you write one section for each month—and you do it by hand—then the section for February would look similar. Except the tough part is, February starts the day after January ends. So, how do you handle which day to print first in February?
The answer isn’t necessarily obvious, though here’s one way to think about it. January starts on whatever day the user passes in (0-6). February starts 31 days after that. So, the weekday February starts on is whatever day of the week is [user input] + 31.
So, one way to figure out February’s starting day is to add 31 days to January’s starting day, then wind those days into 7 day week-segments and see what’s left over. Sounds like a job for modulo arithmetic (% in C).
/* Print February */
int februaryStart = (weekDay + 31) % 7;

printf("n"); // To make space for the next month
printf(" Su Mo Tu We Th Fr San");

/* prints spaces before the first date is printed */
for (i = 0; i < februaryStart; i++) {
  printf("   ");
}


/* prints the dates */
for (i = 1; i <= 28; i++) {
  printf("%3d", i);
  if (!((i + februaryStart) % DAYS_IN_WEEK))
    printf("n");
}
printf("n");
This code works. It prints each month and it adjusts the number of days it prints depending on the month. Mission accomplished, right?
Here’s the part where we presume students see the computational and design inefficiencies that experts would see in this code
This code is wasteful. Can you see why?
Actually, if I hadn’t said it was wasteful would you have even thought it was? Do you think students would have thought it was?
Here’s where it’s wasteful:
This line will end up being repeated exactly as it’s written 12 times, one for each month:
printf(“ Su Mo Tu We Th Fr Sa\n”)
Take a second. Remember what the output months look like

when they’re printed, given the pattern, and convince

yourself that every month has the same seven weekdays in it:

     /* Print January */
     printf(" Su Mo Tu We Th Fr Sa\n")

     ...

     /* Print February */
     printf(" Su Mo Tu We Th Fr Sa\n")

     ...

     /* Print March */
     printf(" Su Mo Tu We Th Fr Sa\n")
For every month, we’re going to want to print each day in the month. But that means we’re essentially repeating this statement:
for(i=0;i<=28;i++)
and only fiddling with the upper limit of `i` (since all months start at 1, but some end at 28, 29, 30, or 31) . So, the pattern means a top-level view of repetition in our code looks like this:

    for (i = 0; i <= 31; i++) // January
    for (i = 0; i <= 28; i++) // February
    for (i = 0; i <= 31; i++) // March
    for (i = 0; i <= 30; i++) // April
For every month, we’re going to want to wrap weeks around the display, so that each 7-day-week of the month is on a new line of the output. Notice how similar the wrapping code for January looks to the wrapping code for February
//January
printf(“%3d”, i);
if (!((i+weekDay) % DAYS_IN_WEEK))
printf(“\n”);
//February
printf(“%3d”, i);
if (!((i + februaryStart) % DAYS_IN_WEEK))
printf(“\n”);
How can we really start to appreciate the wastefulness?
I created the slideshow below to offer a fuller sense of where and why this code is wasteful.
Seeing wastefulness as a way in to procedural abstraction
If you look at how the code is wasteful, what you see is
Identical procedures get repeated
The procedures are repeated on very similar objects (months) for very similar reasons (we need to print each month)
There are elements of commonality in how the procedures differ
In fact, if you look at slide 5 above, the only bits of unique code1 that matter are weekDay and februaryStart. When you look at it that way, it might become obvious that all months of a calendar have 7-day-weeks, and they only really differ in
How many days are in the month
What day of the week starts the month (weekDay and februaryStart are both different names for this same general idea)
To a sharp programmer, then, all the groundwork is there for a procedural abstraction. But now, ask yourself: is it obvious what the abstraction should look like? How do we begin to understand wastefulness? And, how does noticing a pattern of waste in code bring us to a point where the form of a new abstraction is clear?
    // Determine the day offset that starts the month
    // Print enough blank spaces to offset the start
    //     of the month from Sunday
    // Print a number for each day of the month
    // Wrap a display line when you finish a week
From wastefulness to abstraction
Hopefully, I’ve convinced you by now that—in the case of the calendar—seeing the wastefulness can be tightly coupled to developing a procedural abstraction. For myself, I needed to generate my own kind of representation (seen in the slideshow above) to explore common patterns in wastefulness.
I don’t know how other programmers operate, but I find that I can’t move to a level of procedural abstraction without first crafting a clear connection between repetition of code and patterns in procedure. In my slideshow I did that visually—lots of other people might have other ways.
Why this matters for my study
The (at times) extremely fast pace of Intermediate Programming can mean the instructor doesn’t have time to explore the subtleties of sample code. My field notes indicate the instructor discussed the abstraction mechanism in year.c for about 10 minutes. In his full defense, 10 minutes can be an extensive and thorough use of lecture time. Furthermore, I imagine the topic will come up many times throughout the semester. So, I’m not just noticing the amount of time given the topic; I’m also noticing the tone and structure of the discussion in that time.
The instructor started the procedural abstraction discussion by opening year.c and showing students the already-abstracted print_month() procedure:
void print_month(int weekDay, int monthDay)
{
  int i;

  /* print header line */
  printf(" Su Mo Tu We Th Fr San");

  /* prints spaces before the first date is printed */
  for (i = 0; i < weekDay; i++) {
    printf("   ");
  }

  /* prints the dates */
  for (i = 1; i <= monthDay; i++) {
    printf("%3d", i);
    if (!((i+weekDay) % DAYS_IN_WEEK))
      printf("n");
  }
  printf("n");
}
The rest of the discussion was about why this was an obviously better alternative to writing separate procedures for each month. So, the concern here is something Wil would call “giving students solutions to problems they don’t have yet,” or, “handing solutions to students who may not yet realize why the problem even matters.”
If I were a cognitive-constructivist, I’m not quite sure I’d know what to make of the instructor’s approach. Part of me believes that helping students construct knowledge of procedural abstraction should entail an authentic appreciation of what problems might call for it. But, it seemed to me that my creation of the slideshow graphics above was my way of constructing a sense of procedural abstraction for this problem. Furthermore, it gave me a visual metaphor to think with—a pathway to move from an observing wasteful code to identifying common elements, and ultimately wrapping my mind around what pattern was getting repeated.
I think then, that one open question for me is: how do students think about and see procedural abstractions in their own work of trying to solve problems.
excluding comments, which look //like this or /* like this */↩ </fn></footnotes>
“A ‘pre- and post- test’ at age two would have missed them”
This book is an exercise in an applied genetic epistemology expanded beyond Piaget’s cognitive emphasis to include a concern with the affective. It develops a new perspective for education research focused on creating the conditions under which intellectual models will take root. For the last two decades this is what I have been trying to do. And in doing so I find myself frequently reminded of several aspects of my encounter with the differential gears. First, I remember that no one told me to learn about differential gears. Second, I remember that there was a feeling, love, as well as understanding in my relationship with gears. Third, I remember that my first encounter with them was in my second year. If any “scientific” educational psychologist had tried to “measure” the effects of this encounter, he would probably have failed. It had profound consequences but, I conjecture, only very many years later. A “pre- and post-” test at age two would have missed them. (Papert, 1980, pp. vii-viii); emphasis in original
As I begin my odyssey into the comps process, I’ve tried to start at a useful beginning: the writings of Seymour Papert. Papert’s 1980 book Mindstorms is regarded by many—at least in the fields of education and learning sciences—as a classic on how children learn with computers. In the beginning of the book he describes being curious about gears as a child and how that curiosity helped him build his own personal ways of knowing about mathematics. What I’d like to do in this post is take apart some of the assertions Papert makes in the above-quoted passage, which is excerpted from the book’s foreword: “The Gears of My Childhood.”
First, Papert calls his book an “exercise in an applied genetic epistemology.” But, what does he mean by genetic epistemology? For that matter, if there is an “applied” kind of genetic epistemology, could there be another kind? Let’s step back for just a moment. The phrase “genetic epistemology” itself traces as far back at least as Jean Piaget, with whom Papert worked for several years. In a previous paragraph, Papert writes:
I was developing a way of thinking that would be resonant with Piaget’s. The understanding of learning must be genetic. It must refer to the genesis of knowledge. What an individual can learn, and how he learns it, depends on what models he has available. This raises, recursively, the question of how he learned those models. Thus, the “laws of learning” must be about how intellectual structures grow out of one another and about how, in the process, they acquire both logical and emotional form. (Papert, 1980, p. vii; emphasis in original)
I think Papert’s summary of genetic epistemology is clear enough for now, though I’ll add one historical and interpretive note. In my understanding of Piaget—an understanding based on admittedly brief slice of the man’s work: his 1970 article on his own theory—what Piaget sought was an explanation for where knowledge comes from. Specifically, he wanted to know where structures of knowledge come from. Most scholars I’ve talked to who study Piaget argue that his training in both biology and philosophy deeply influenced his search for how structures of knowledge come to be. In short, if there is some base structure (viz. DNA) that co-directs how physical biological structures (arms, eyes, hurty parts on insects) emerge and develop, might one not also search for the epistemological developmental structures that co-direct how knowledge (and its forms) develop. That, in one wordy sentence, is my nutshell read of the relevant Piaget bits for this discussion. Back to Papert.
“both logical and emotional form”
Piaget’s original work—summarized in his 1970 article—sketches a possibility for the genesis of the logical forms of knowledge humans develop. It is, rather chiefly, concerned with structures responsible for our abilities to reason about quantities, forms, and conservation. But it’s not about emotion. Piaget didn’t attempt to explain how it feels to reason about coins and fluids. Piaget also doesn’t address the role of emotion in the building of cognitive structures.
Papert, in defense of Piaget, suggests Piaget was far from ignorant about the whole thing. Below, he argues that Piaget wasn’t blind to the role of emotion in assimilation—assimilation being Piaget’s word for how we graft new knowledge, in light of experience, to our current cognitive structures. Below, Papert explains:
[Piaget] talks almost entirely about cognitive aspects of assimilation. But there is also an affective component. Assimilating equations to gears certainly is a powerful way to bring old knowledge to bear on a new object. But it does more as well. I am sure that such assimilations helped to endow mathematics, for me, with a positive affective tone that can be traced back to my infantile experiences with cars. I believe Piaget really agrees. As I came to know him personally I understood that his neglect of the affective comes from a modest sense that little is known about it than from an arrogant sense of its irrelevance.
Throughout the foreword, Papert argues that his own experience with gears wasn’t just knowledge-building. Rather, his interaction with gears became a form of emotional knowledge building. For me, it’s difficult to disagree with Papert. Affect, knowledge-building, and knowledge-use are interconnected to far too high a degree. If, for example, I think about a poem excerpt, I think both of how I felt when I read it, how reading it changed the way I read poetry, and how that resultant change gave me the confidence to keep reading poetry. At the Honors Convocation ceremony of my college graduation, my mentor read to us a poem called “At The Border” by Carl Dennis. The poem begins:
At the border between the past and the future
No sign on a post warns that your passport
Won’t let you return to your native land
As a citizen, just as a tourist
I was astounded. I was moved. I had never before thought of my graduation experience—or of any part of moving on in life—in the plainspoken yet profound way the poem suggested. But there I was, ironically, at the border, and being paradoxically warned for that brief moment in time that no sign would let me know I couldn’t come back.
The experience stuck with me. I’ve remembered the poem, but also the experience of trying to make sense of it. I’ve also remembered to keep trying; to look for new poetic experiences. I think that’s what Papert’s after when he talks about the importance of the emotional in building knowledge forms. It’s about much more than being happy when one learns; it’s about recognized that the feelings we have as we learn become part of the matrix of what we learn, and how that knowledge continues to integrate as we move forward with new experiences.
“creating the conditions under which intellectual models will take root”
This is what we’re all about. If learning derives from models, and we build models in part with and around emotional experiences, then understanding “the conditions under which intellectual models will take root” might well be the most important question we strive to answer with research on learning.
Except I think it’s easy to get distracted. It’s easy to think that what Papert means as “conditions” are things like how we build our schools, how we design our lessons, and what technology is (or isn’t) available. But those are material conditions. To me, they’re a subset of all the things we could think about when we mean conditions.
Again, let’s revisit Papert’s (1980, pp. vii-viii) three assertions in the original quote, paraphrasing where needed to make the point:
No one told me to learn about differential gears
I felt a feeling, love, as well as an understanding in my relationship with gears
I was two; a pre- post- test at the time was hardly an option to measure my learning
Point 1 isn’t about material conditions at all, really. If anything, it’s about the lack of externally-imposed constraints. Point 2, on which I elaborated quite a bit, seems to say that emotion is as much a building material in constructivism/constructionism as is any knowledge or sensory element. Point 3? We can have meaningful experiences with the world that many of the research methods we deploy in education would fail to capture.
References
Dennis, C. (2007). Unknown Friends. New York: Penguin Books. Retrieved from http://lccn.loc.gov/2006050716
Papert, S. (1980). Mindstorms: Children, Computers, and Powerful Ideas. New York: Basic Books. Retrieved from http://lccn.loc.gov/79005200
Piaget, J. (1970). Piaget’s Theory. In P. H. Mussen (Ed.), Carmichael’s Manual of Child Psychology (3rd ed., Vol. 1, pp. 703-732). New York: Wiley. Retrieved from http://lccn.loc.gov/69016127
I heard so many interesting talks, met so many provocative people, and thought so hard about computation that I’ll never hear the words “this is a test” the same way again.
One highlight for me was talking with Mark Guzdial about pictures and sounds as transformations of binary information. As I continue to think about intersecting possibilities for our brand of scientific inquiry and what promise it might hold in CS, I’m definitely going to turn my attention toward core concepts in how we represent information. More importantly, perhaps, are issues of how we generate, modify, and understand information.
Another was raising issues of what counts as evidence, and how we define learning. I really look forward to having more interesting conversations about what we think we’re studying when we try to study student learning.
A third was getting to continue ongoing conversations about education with friends, both old and new. To me, the heart of a good conference is the way our interests and ideas about central problems in the field spill outside the bounds of sessions and talks. These conversations are what excite and energize me.
Finally, I had an amazing time at the pre-conference Doctoral Consortium (DC). I was able to meet colleaguesfromacrosstheworld who are starting (or, in some cases wrapping up) their dissertations. It was a thrill to see the variety of problems people are taking on and an amazing opportunity to both get and give detailed feedback on our work.
Beginning work on epistemological dynamics in programming
I’m preparing for my comprehensive examinations (comps), which are essentially three in-depth essays written and revised under the direction of a faculty member. My second comp is actually my work on a statistical graphics package called granova, but I’ll be discussing that subject in another post. Here, I want to talk about my third comp, which will hopefully become the springboard to a dissertation proposal.
If I’m doing my job right, this post will grow into a much larger series of posts, and hopefully (when well-watered, cared for, and nourished) a dissertation. To get there, here are some of the core questions I think I’ll need to address.
What are epistemological dynamics? What do I mean when I’m talking about epistemologies and epistemological dynamics? What does that idea do as a technical construct?
Where do epistemological dynamics come from? What’s their genesis as a research construct? More to the point, what do they allow us to explain and predict?
Why do epistemological dynamics matter for learning to program? This has to go beyond simply arguing that “they matter.” Many, many things affect the ways individuals learn to program. The subquestions here surround how we can use the study of epistemological dynamics in programming?
Can they push research efforts forward, illuminating erstwhile unseen problems?
Can they push the theoretical discussion forward, explaining the otherwise un- or underexplained?
Finally, can they inform pedagogy? Can epistemological dynamics help us craft educational experiences around programming that attract, retain, and empower students?
As part of my work preparing for the 2011 International Computing Education Research Conference (ICER), I’ll be working through a presentation that tries to flesh out these issues. The goal there is to craft a form of these dissertation ideas that conference attendees can critique. Keep your eyes on the blog as I continue to expand my ideas and hopefully tackle—or refine—the above roadmap of questions.

")