Homework 1 - Making Plots in Blockpy
25 Jan 2017Due Monday (1/30) at 11:59pm
What I’d like you to do
Using the built-in datasets in blockpy (http://think.cs.vt.edu/blockpy/load),
- Make a blockpy program that generates three plots.
- Of those three plots, there should be at least two different kinds of plots. So, two scatterplots and a histogram is great. A histogram, a line plot, and a scatterplot is great. Three histograms is less than great.
- For each plot, write about 3–5 sentences about your experience making it. Try to answer questions like:
- Is this data what I expected? (I thought it would be numbers, but it seems like it’s not.)
- Do I see any patterns or relationships in this data? What are they?
- Does this plot even make sense to me?
- If this plot seems broken, how would I explain what’s broken?
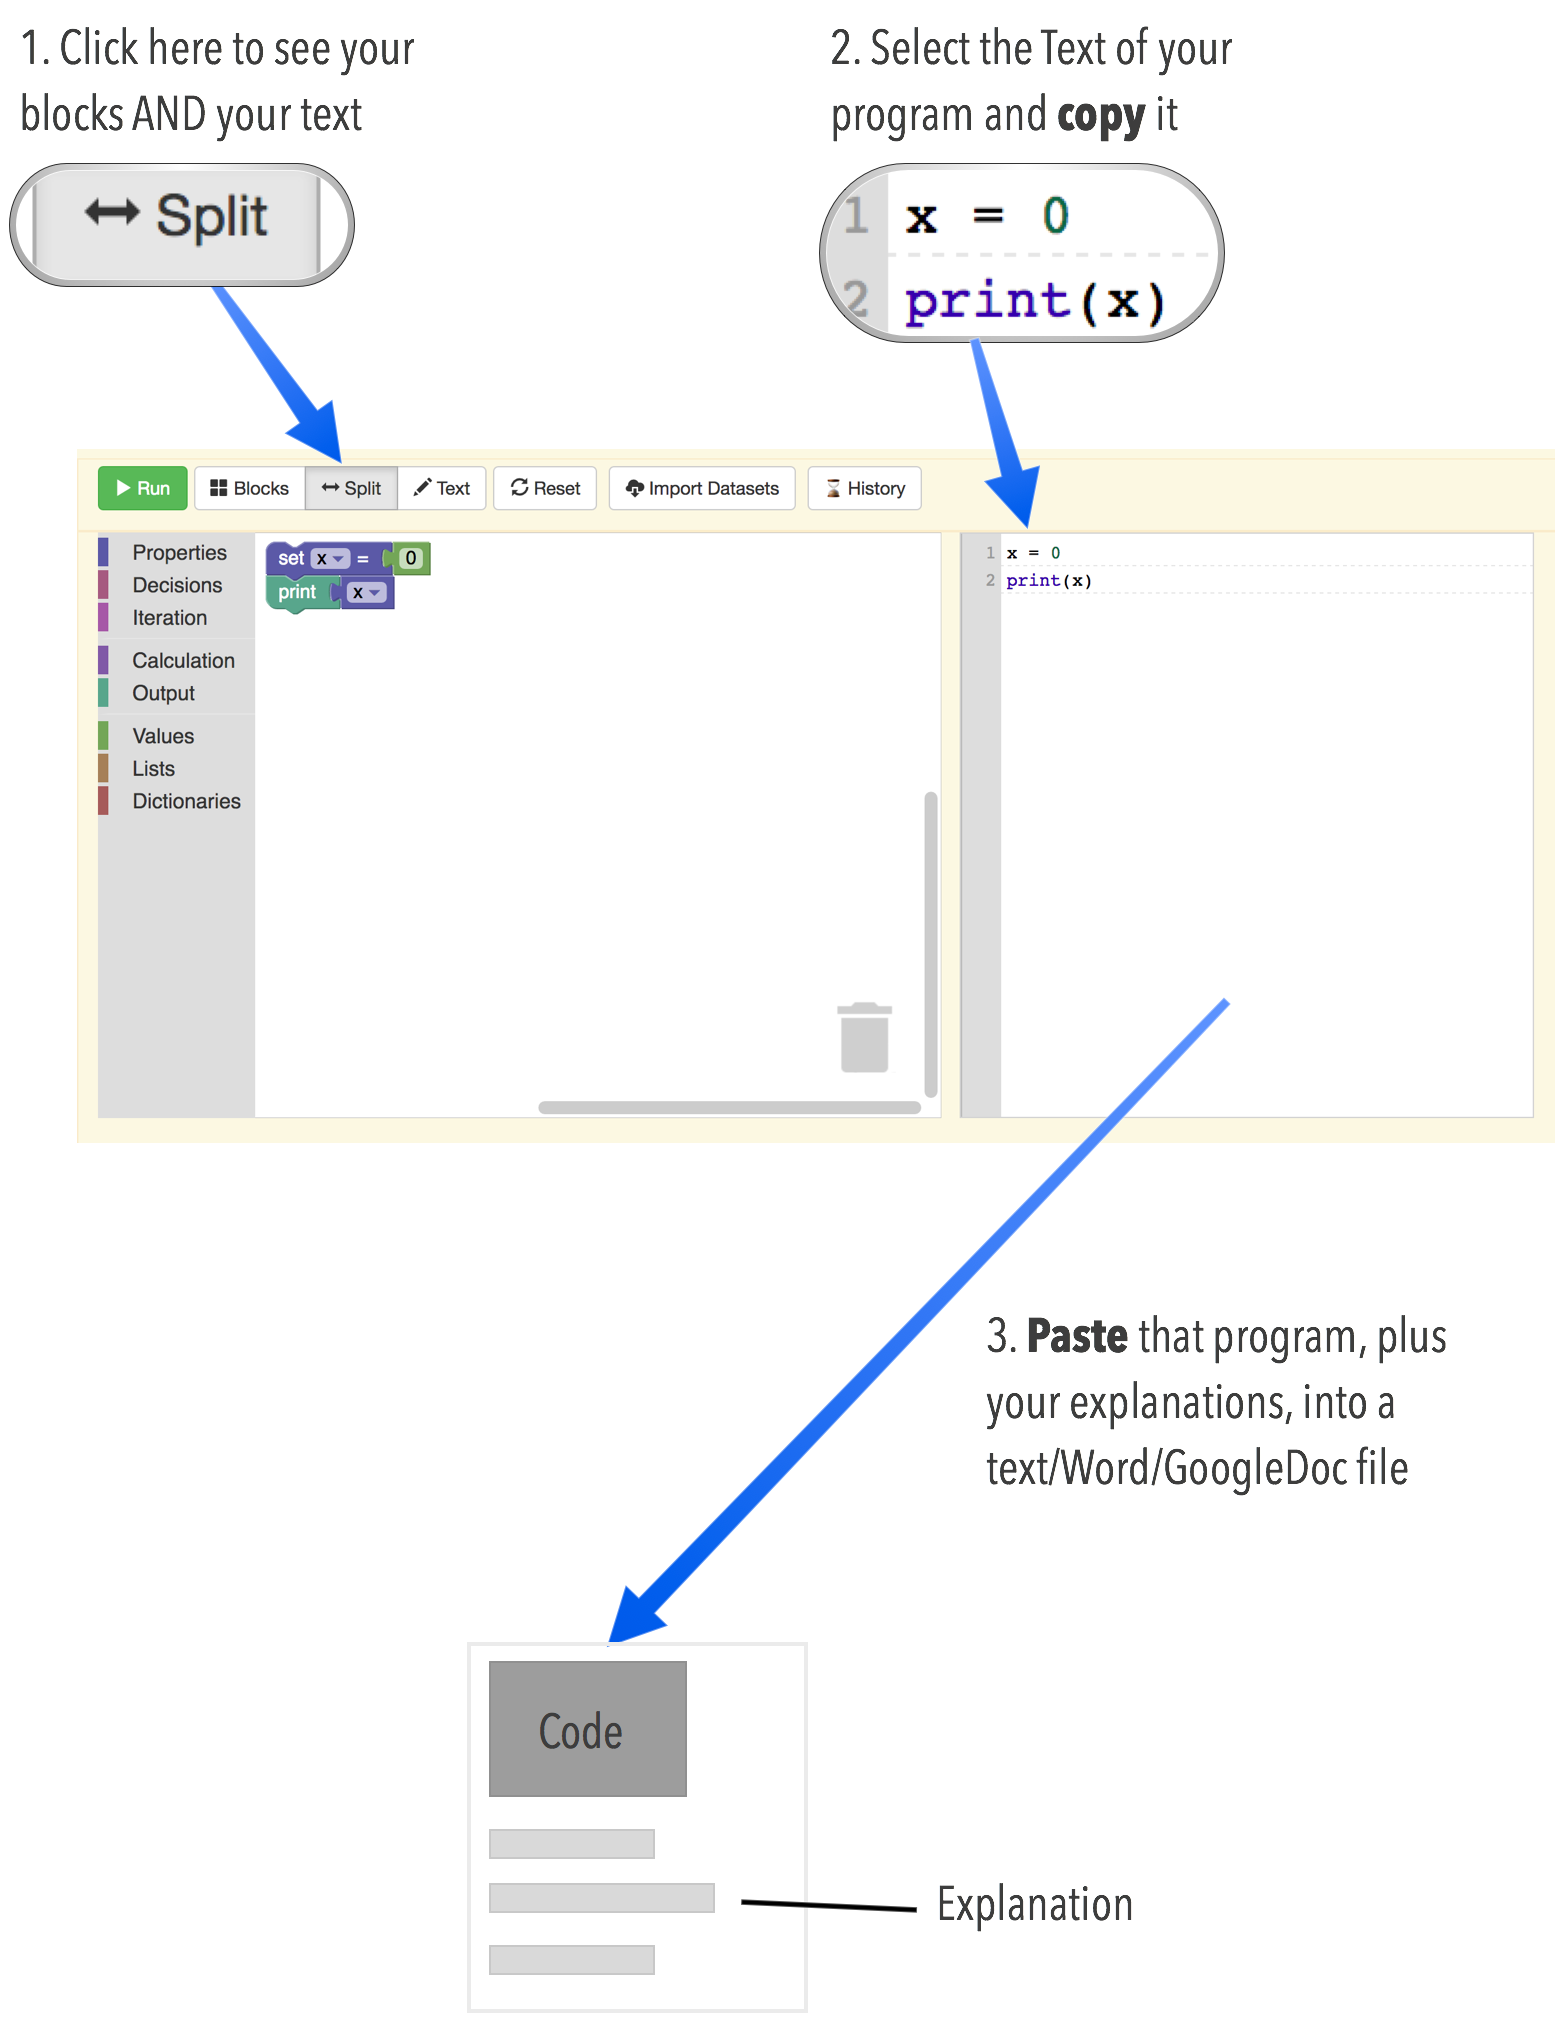
What you should turn in
A document (could be a Word document, or just a plain .txt file) where:
- You paste in the text code from your Blockpy program to make all three plots
- You have written 3-5 sentences per plot